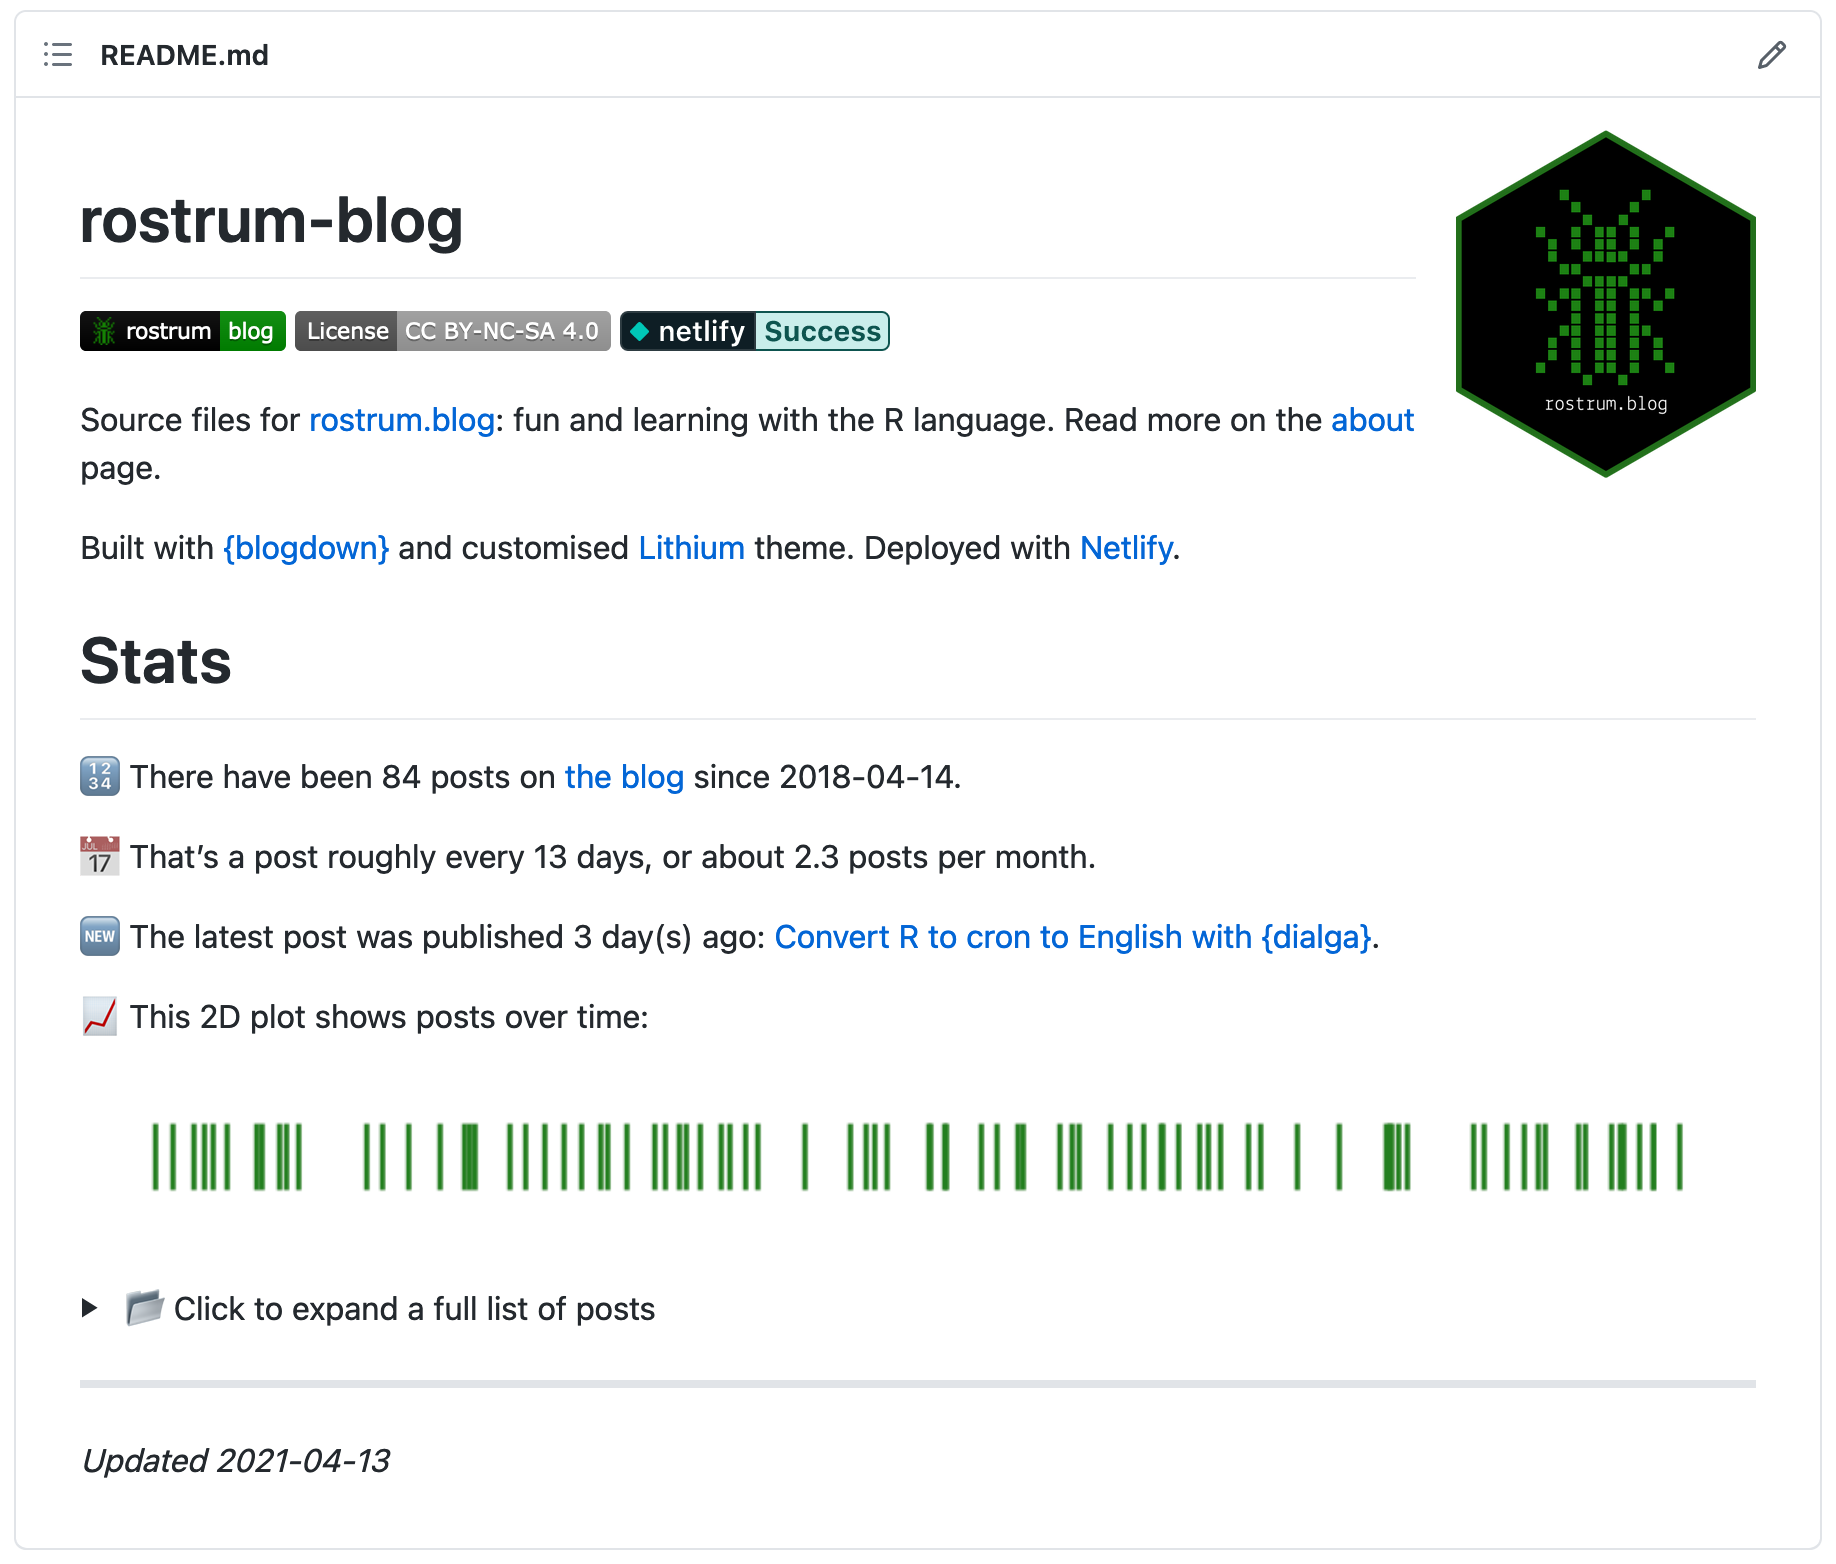
Yesterday’s render of the GitHub README for this blog.
tl;dr
You can use a scheduled GitHub Action to render up-to-date stats about your blog into its README.
Happy blogday
This blog has been knocking around for three years now. I wrote a post on its first birthday with a simple, interactive 2D plot of the posts to date.
Only now, two years later, have I thought to put this info into the blog’s README on GitHub—along with some other little stats, like total number of posts—and have it update automatically on a schedule using a GitHub Action.1
This is useful for me so I can keep track of things without counting on my fingers, but it also signals activity on the blog to any curious visitors. I may change its content at some point, but it does what I want it to do for now.
Unwrap your GitHub Action
I’ve scheduled a GitHub Action for the early hours of each day. The YAML file for it reads like ‘at the specified time2, set up a remote environment with R and some dependencies, then render the R Markdown file and push the changes to GitHub.’
I’ve modified r-lib’s pre-written YAML for this, which can be generated in the correct location in your project with usethis::use_github_action("render-rmarkdown.yaml").
Click for the GitHub Action YAML
name: Render README

on:
  schedule:
    - cron: '09 05 * * *'

jobs:
  render:
    name: Render README
    runs-on: macOS-latest
    env:
      GITHUB_PAT: ${{ secrets.GITHUB_TOKEN }}
    steps:
      - uses: actions/checkout@v2
      - uses: r-lib/actions/setup-r@v1
      - uses: r-lib/actions/setup-pandoc@v1
      - name: Install CRAN packages
        run: Rscript -e 'install.packages(c("remotes", "rmarkdown", "knitr", "tidyverse"))'
      - name: Install GitHub packages
        run: Rscript -e 'remotes::install_github("hadley/emo")'
      - name: Render README
        run: Rscript -e 'rmarkdown::render("README.Rmd")'
      - name: Commit results
        run: |
          git config --local user.email "actions@github.com"
          git config --local user.name "GitHub Actions"
          git commit README.md README_files/ -m 'Re-build README.Rmd' || echo "No changes to commit"
          git push origin || echo "No changes to commit"
Basically, the action knits the repo’s README.Rmd (R Markdown format containing R code) to a counterpart README.md (GitHub-flavoured markdown), which is displayed when you visit the repo.
PaRty time
The real magic is in some R code chunks at the top of the README.Rmd file itself. There’s some R code there that uses {rvest} to scrape the archive page of the blog and create a dataframe of the titles, links and publish dates of each post.
Click for the scraping code
# Attach packages
library(tidyverse) # CRAN v1.3.0
library(rvest)     # CRAN v1.0.0

# Scrape the rostrum.blog home page
html <- read_html("https://rostrum.blog/")

# Extract the post titles
title <- html %>%
  html_nodes(".archive-item-link") %>%  # extract title node
  html_text()                           # extract text

# Extract the post URLs
link <- html %>%
  html_nodes(".archive-item-link") %>%  # extract title node
  html_attr("href")                     # extract href attribute

# Extract the post dates
date <- html %>%
  html_nodes(".archive-item-date") %>%  # extract date nodes only
  html_text() %>%                       # extract text
  str_replace_all("[:space:]", "")      # remove newline/space

# Dataframe of titles and dates
posts <- tibble(date, title link), %>%
  transmute(
    n = nrow(.):1,             # number starting from first post
    publish_date = ymd(date),  # convert to date class
    title,                     # title text
    link = paste0("https://www.rostrum.blog", link)  # create full URL
  )
That information can be cajoled to show some basic stats. The README includes inline R code that renders to show:
- the total number of posts
- posting rates (posts per month and days per post)
- the number of days since since the last post and a link to it
- a clickable details block containing a table of all the posts to date
- a simple 2D plot showing the distribution of posts over time3 (preview below)
Click for plot code
# Create plot object
p <- posts %>%
  ggplot(aes(x = publish_date, y = 1)) +
  geom_point(shape = "|", size = 10, stroke = 1, color = "#1D8016") +
  theme_void()
I also added a call to lubridate::today() at the bottom of the README.Rmd so it’s obvious when the stats were last updated.
Until next year
Finally, and most importantly, I included a tiny Easter egg: an emoji balloon 🎈 will appear on the page when the README is rendered on the anniversary of the blog’s inception.4
Session info
## ─ Session info ───────────────────────────────────────────────────────────────
##  setting  value
##  version  R version 4.0.4 (2021-02-15)
##  os       macOS Big Sur 10.16
##  system   x86_64, darwin17.0
##  ui       X11
##  language (EN)
##  collate  en_GB.UTF-8
##  ctype    en_GB.UTF-8
##  tz       Europe/London
##  date     2021-04-14
##
## ─ Packages ───────────────────────────────────────────────────────────────────
##  package     * version    date       lib source
##  assertthat    0.2.1      2019-03-21 [1] CRAN (R 4.0.0)
##  blogdown      1.2        2021-03-04 [1] CRAN (R 4.0.2)
##  bookdown      0.21       2020-10-13 [1] CRAN (R 4.0.2)
##  cli           2.3.1      2021-02-23 [1] CRAN (R 4.0.2)
##  crayon        1.4.1      2021-02-08 [1] CRAN (R 4.0.2)
##  digest        0.6.27     2020-10-24 [1] CRAN (R 4.0.2)
##  emo           0.0.0.9000 2021-03-01 [1] Github (hadley/emo@3f03b11)
##  evaluate      0.14       2019-05-28 [1] CRAN (R 4.0.0)
##  generics      0.1.0      2020-10-31 [1] CRAN (R 4.0.2)
##  glue          1.4.2      2020-08-27 [1] CRAN (R 4.0.2)
##  htmltools     0.5.1.9000 2021-03-11 [1] Github (rstudio/htmltools@ac43afe)
##  knitr         1.31       2021-01-27 [1] CRAN (R 4.0.2)
##  lubridate     1.7.10     2021-02-26 [1] CRAN (R 4.0.2)
##  magrittr      2.0.1      2020-11-17 [1] CRAN (R 4.0.2)
##  purrr         0.3.4      2020-04-17 [1] CRAN (R 4.0.0)
##  Rcpp          1.0.6      2021-01-15 [1] CRAN (R 4.0.2)
##  rlang         0.4.10     2020-12-30 [1] CRAN (R 4.0.2)
##  rmarkdown     2.6        2020-12-14 [1] CRAN (R 4.0.2)
##  sessioninfo   1.1.1      2018-11-05 [1] CRAN (R 4.0.0)
##  stringi       1.5.3      2020-09-09 [1] CRAN (R 4.0.2)
##  stringr       1.4.0      2019-02-10 [1] CRAN (R 4.0.0)
##  withr         2.4.1      2021-01-26 [1] CRAN (R 4.0.2)
##  xfun          0.21       2021-02-10 [1] CRAN (R 4.0.2)
##  yaml          2.2.1      2020-02-01 [1] CRAN (R 4.0.0)
##
## [1] /Library/Frameworks/R.framework/Versions/4.0/Resources/library
I’ve written before about GitHub Actions to create a Twitter bot and for continuous integration of R packages.↩︎
I wrote about scheduling with cron strings in an earlier post, which details the {dialga} package for translating from R to cron to English.↩︎
The original chart was made with {plotly}, so you could hover over the points to see the post titles and publishing dates. Plotly isn’t supported in GitHub Markdown, so I included a static chart instead. I used a similar ‘barcode’ format in a recent post about health data.↩︎
That’s today if you’re reading this on the day it was published.↩︎